Assignment 1
Please note that due dates can be found in the Syllabus; submission instructions can be found on the Assignment Instructions page. In this assignment, you can submit a Google Doc (or other text editor, pictures, etc.) but also your \({\tt R}\) code via Google Drive. Aki will go over the submission process in the lab.
\({\bf 50}\) total marks.
Question 1 [7 points] You obtained a \({\tt gmail}\) account for this course. With this account, you can also initiate your Google Drive workspace. (i) Does Google have the right to look at your emails, documents, drawings or other objects? (ii) Does Google have the right to use this information? What is meta-data? Can it collect meta-data about your information? (iii) How can you turn on or off the geographical tracking mechanism associated with your account? (iv) Are you satisfied with the level of security and user agreement with Google? (Answer in ~10 sentences please.)
Question 2 [3 points] Does cloud computing reduce the overall cost for computers and computation for the “average” person? If so, how? Make reference to the definitions and components of cloud and traditional computing from the lecture notes. 4 or 5 sentences.
Question 3 [3 points] Give an example of how concepts from computation drifted into the life sciences? 3 or 4 sentences.
Question 4 [3 points] Argue for and against each of the following items as a computing device (make references to the 3 fundamental properties of modern computers).
- compass
- a car
- an assembly line to make cars at the Ford Inc. factory
Question 5 [4 points] What privacy issues might arise in -omic studies? Are the issues of privacy more or less acute in a transcriptome-based study (as we saw in class) than say a genomic DNA-based study (sequencing the genome of individuals)? Remember that both studies are based on sequencing RNA and DNA of samples
Question 6 [4 points] Create a \({\tt R}\) script under \({\tt File/NewFile}\). Write R code to load the \({\tt tidyverse}\) library and the \({\tt small\_brca}\) dataset. Note that in the course slides, I load the dataset from my directory specific to my computer. However, if you look in the R code in the \({\tt src}\) on RStudio Cloud (Project 03), you will find the correct path for you.
Make a comment that this is Question 6, Assignment 1 before your code. Find the function in \({\tt R}\) that reports the date and the version of \({\tt R}\) that you are using. Put the code in your file.
Save your R code in your \({\tt src}\) directory of the project and name the file \({\tt lastname\_assignment1.R}\). Take a screenshot with your file open (top left), the Environment list showing (top right), the code executed in your R session (bottom left), and the contents of the \({\tt src}\) folder (bottom right). Congratulations, you are now an R programmer.
For Questions 7-10 below. Put a comment in your file that states what question you are working on and put your code below it. For any pictures (eg the plot that your code generates) and text, put them into a text document (eg using Google Docs) stating what question you are working on.
Question 7 [5 points]
Recall from the lecture that \({\tt HER2}\) is an important protein in some subtypes of breast cancer, and remmeber that \({\tt ERBB2}\) is the official name for \({\tt HER2}\).
The variable \({\tt ERBB2}\) in our tibble corresponds to estimates of the number of transcripts present in each sample (row). This is obtained using RNA-seq technologies as discussed in the lecture. Clinically, \({\tt HER2}\) is not measured using transcriptomics. Typically the copy number of \({\tt HER2}\) is measured at at the DNA level. This is because we believe that \({\tt HER2}\) over-expression at the transcript and protein levels are due to a amplification of the genomic region tha contains \({\tt HER2}\). In the clinic, Fluorescence In Situ Hybridization (FISH) is used.
The variable \({\tt her2\_fish\_status}\) gives exactly this, although it is not available for many observations (rows/patient samples).
Using ggplot, making the following scatter plot. Make a comment in your file from Question 6 and make a comment that this is Question 7. Put your R code there.
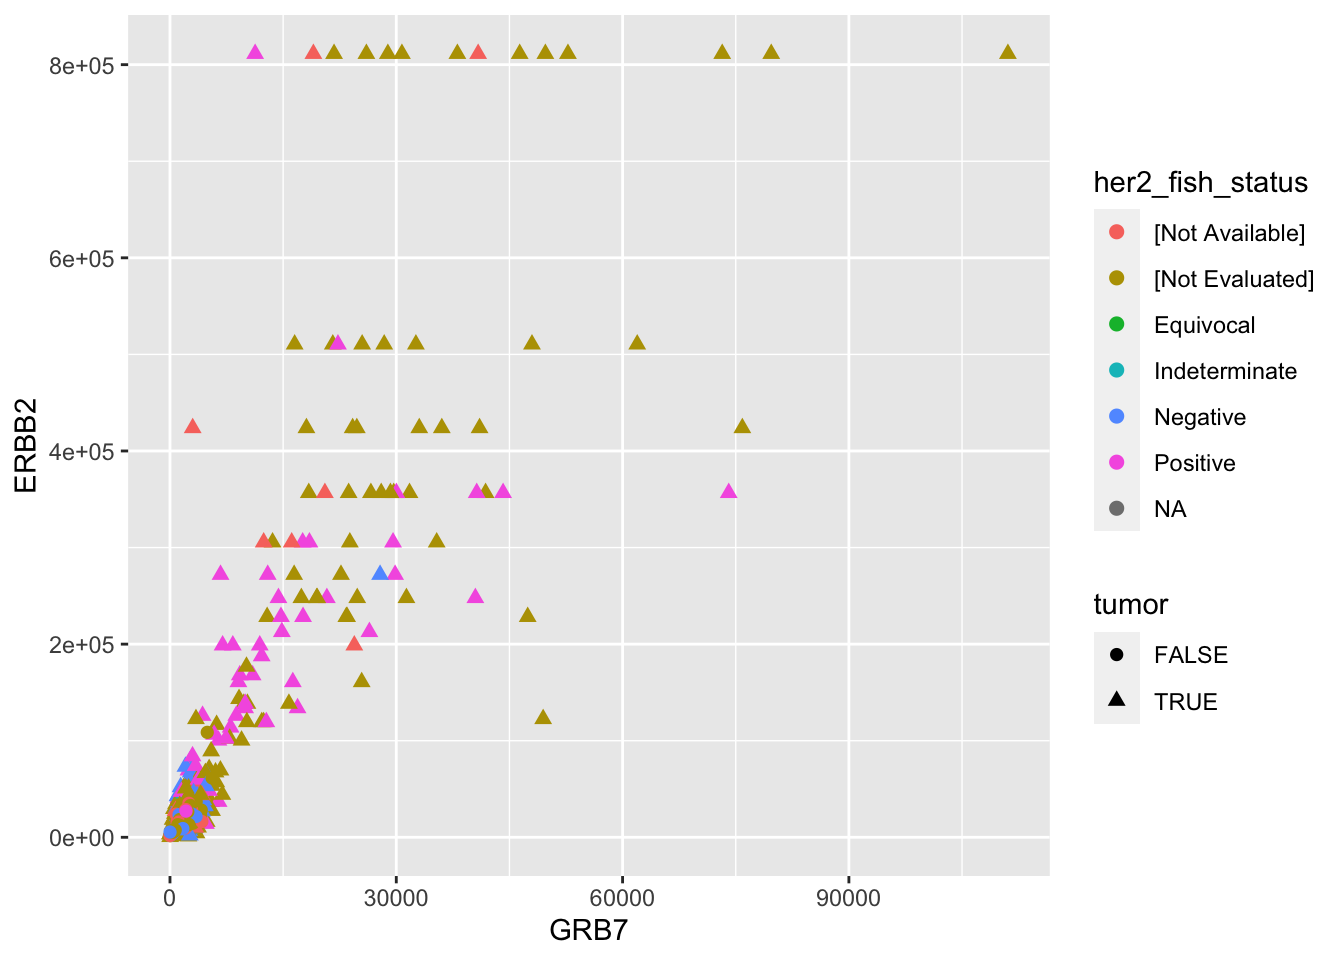 Comment or interpret the graph in 1 or 2 sentences: does it make sense? is it what you expected? are there issues? etc.
Question 8 [5 points]
It is a little bit hard to see the status of \({\tt tumor}\) and \({\tt her2\_fish\_status}\) in the figure of Question 7 because so many points are bunched up around the origin of the graph. Using online resources, find out how to draw a pie chart for each of these variables. Does this add any insight to the plot from Question 7?
Question 9 [5 points] Similar to Question 7, the variable \({\tt ESR1}\) corresponds to transcript levels of the estrogen receptor. In the clinic, the estrogen receptor protein is measured by ImmunoHistoChemistry.
The variable \({\tt er\_status\_by\_ihc}\) has this value. Create a scatterplot of \({\tt ESR1}\) transcript versus \({\tt ERBB2}\) transcript, but use colors, shape, size or other options to also display both the \({\tt er\_status\_by\_ihc}\) and \({\tt her2\_fish\_status}\) status. Interpret this graph in 1 or 2 sentences.
Question 10 [5 points] Create a barplot (like Slide 28 of L03) that explores the relationship between \({\tt ajcc\_pathologic\_tumor\_stage}\) and \({\tt er\_status\_by\_ihc}\). Comment (interpret) in 1 or 2 sentences on the graph.
Question 11 [2 points] Suppose I create five logical variables; the first three represent each of my children and the last two represent my wife and I. The kids variables are set to \({\tt TRUE}\) if and only they had vegetables at lunch. My wife and I are set to \({\tt TRUE}\) if and only if we are exhausted. So in the example below, my wife is exhausted and I’m ok; two of our kids had vegetables.
c1 <- TRUE; c2 <- FALSE; c3 <- TRUE; wife <- TRUE; me <- FALSEI would like you to write some R code to evaluate whether we will order pizza or not. The condition is that at least one of my children ate vegetables at lunch.
To give you an example, suppose I don’t care if my kids had vegetables or not; we order pizza if both my wife and I are exhausted. My logical expression would be:
(wife & me)
## [1] FALSE
Question 12 [4 points] Building on Question 11, write a logical expression using \({\tt AND~\&}\), \({\tt OR |}\) and \({\tt NOT !}\) operators on these five variables. Here the logical expression should be \({\tt TRUE}\) only when all of my children had vegetables at lunch and if both my wife and I are exhausted. Otherwise it is \({\tt FALSE}\) and we make salad.
Good luck!