Assignment 2
Please note that due dates can be found in the Syllabus; submission instructions can be found on the Assignment Instructions page. In this assignment, you can submit a Google Doc (or other text editor, pictures, etc.) but also your \({\tt R}\) code via Google Drive. Aki will go over the submission process in the lab.
You might consider (but it is not mandatory) using R Markdown to write your answers.
\({\bf 50}\) total marks.
Question 1 [1 points] Re-express the following small program using pipes.
x<-3; mu<-5; sigma <-7
nrm <- ( 1 / (sigma * sqrt( 2 * pi ))) * exp( -(1/2) * ( (x - mu)/ sigma )^2)
Hint:
p <- c( first = "a", second = "b", third = "c")Bonus [1/2 point] What is this equation?
Question 2 [3 points] Re-express the following small program using pipes.
site <- 15
gsub(";", "/", paste(paste( paste( "~hallett", paste("raw", "tara", sep = ";"), sep = ";"),
      paste("site", site, sep="_"), sep=";"),
      "dna_seq.fa", sep=";"))
## [1] "~hallett/raw/tara/site_15/dna_seq.fa"
Question 3 [6 points]
3a [1 point] How many black or african women are included in the \({\tt small\_brca}\) dataset?
3b [1 point] How many black or african males?
3c [3 points] Create a histogram of all black or african individuals grouped by age. Each bar in the histogram should have two colours corresponding to male and females. (For example, red might be used for the fraction of women in some age group while blue is used for men in that same age group). Choose the number of bins (or binsize) in a way that makes your plot informative.
3d [1 point] What was the rationale for the number of bins you used?
Show code for all parts \(3a\) to \(3d\).
Question 4 [7 points]
4a [2 point] How many participants are there? (Careful: not samples but participants.) Show code.
4b [3 points] List all of the \({\tt participant}\) that have more than one sample. Show code.
4c [2 points] For the participants identfied in 4b, create a scatter plot with the tumor on the \(x\) axis and the normal on the \(y\) axis (as specified by the \({\tt tumor}\) variable in the tibble) with points representing the expression of gene \({\tt ESR1}\).
Show your code for each step.
Question 5 [7 points]
Create the following plot using the \({\tt small\_brca}\) tibble.
## Warning: Removed 6 rows containing missing values (geom_point).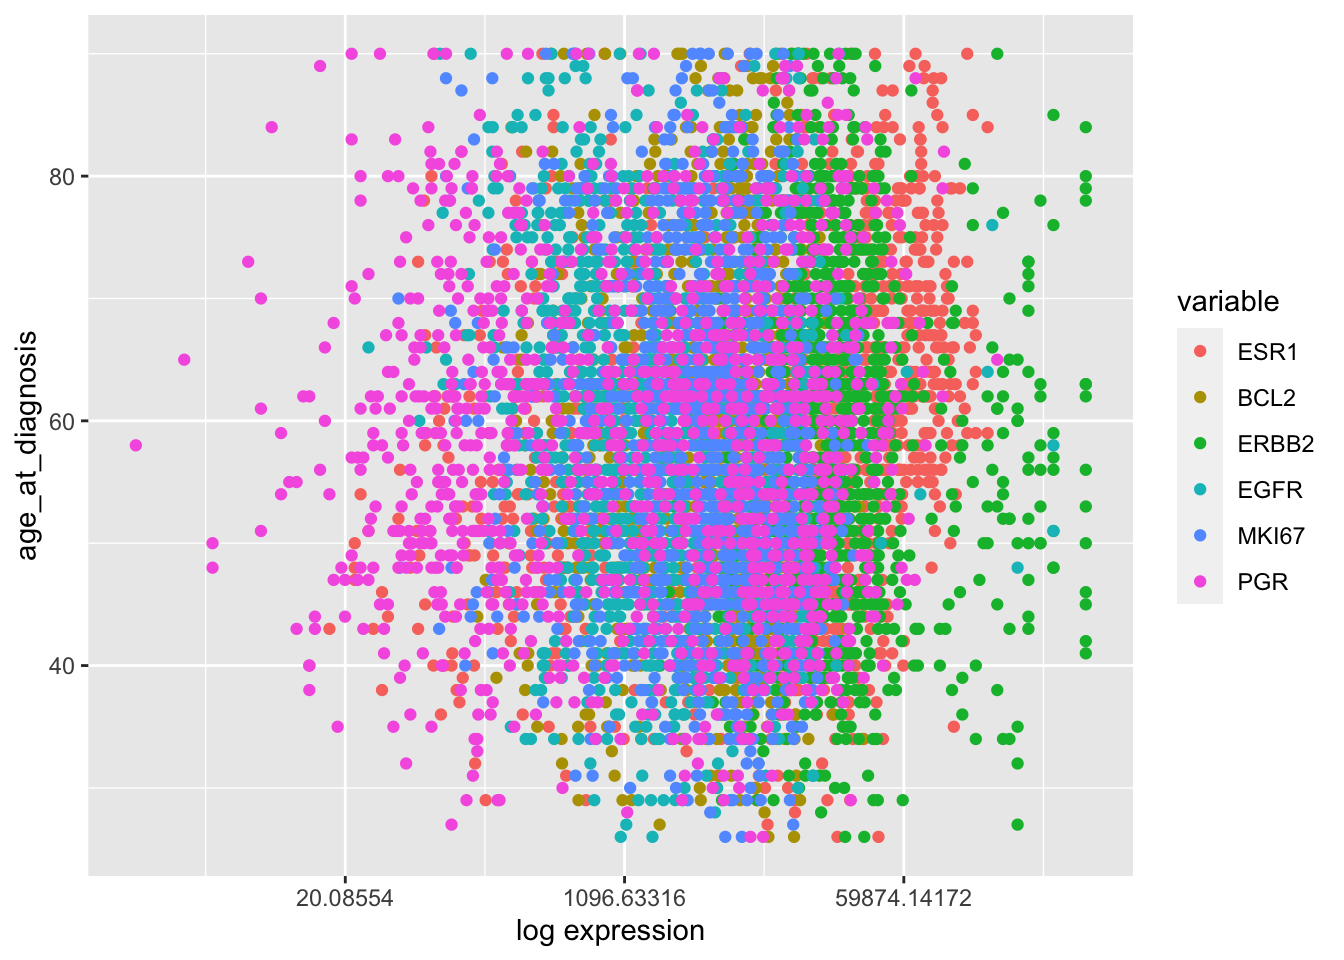
Question 6 [4 points]
In the lecture I said that the violin plot has killed the boxplot. Maya, your classmate, contradicted me and suggested boxplots are, actually, cool. Well I thought then that the whole class should get another question to explore Maya’s suggestion. Let’s all thank Maya!!
6a [3 points] In one figure (hint: \({\tt ggarrange}\)) using the log-transformed expression of \({\tt ESR1}\) create (i) a boxplot, (ii) a violin plot, (iii) a boxplot with beeswarm.
6b [1 point] In your opinion - whatever you think now - which is the nicest?
Question 7 [5 points]
The variable \({\tt race}\) in \({\tt small\_brca}\) has several different possible values including “WHITE”, “ASIAN”, “BLACK OR AFRICAN AMERICAN”, “AMERICAN INDIAN OR ALASKA NATIVE”, “[Not Available]”, “[Not Evaluated]”, or NA.
It is better to simply use NA instead of“[Not Available]”, “[Not Evaluated]”, or NA. It will simplify your code in downstream analyses.
Write R code to create a new \({\tt race\_modified}\) variable where all samples with “[Not Available]”, “[Not Evaluated]” are changed to NA (Note: you shouldn’t use “NA”, but NA. They are not the same)
Question 8 [5 points]
Samples may have differences in the distributions of expression across the genes. This might be caused by technical noise because often not all samples are processed at the same time or the samples might be prepared slightly differently. This difference in distributions can sometimes get in the way of our analysis, especially when we are looking at many genes at the same time. A common approach that sometimes helps is to median center the expression of each gene. For each observation (row), the median centering transforms transcript counts \(G = (g_1, g_2, \ldots, g_n)\) to \(G'= (g'_1, g'_2, \ldots, g'_n)\) where \(g'_i = g_i - median(G)\). Here \(n\) is the number of genes (in our case \(n=50\)).
Show code to create a new tibble where all expression measurements are median centered.
Question 9 [7 points]
Different genes have different distributions of expression. We saw evidence of this in Lecture 06 (slide 25) when we created a violin plot across all \(50\) of our genes. This difference in distributions can also sometimes get in the way of our analysis, especially when we are looking at many genes at the same time. Or sometimes we want to only those genes that have large or highly variable expression.
9a [1 point]: Using online resources, define what the variance of a distribution is. Find a function in R to compute the variance.
9b [4 points]: Compute the variance for each of the \(50\) genes in our dataset, create a tibble with just the \({\tt participant}\) and \({\tt race}\) variables along with the \(50\) genes. Order the columns (variables) of the tibble from most to least variable.
9c [2 points]: Create a violin plot of the \(50\) genes ordered from most to least variable.
Question 10 [5 points] Pick one of the \(50\) genes from \({\tt small\_brca}\) uniformly randomly (see the \({\tt runif}\) function). Using the NCBI, provide the following information or note that it is not availalbe:
10a Full name of the gene and the official name according to the HGNC.
10b First time it was reported in the literature.
10c Where it is located in the genome.
10d Its \({\tt gi}\) acccession code or codes (if it has been modified).
10e The number of exons.
10f The number of alternative transcripts that have been record.
10g Its full amino acid sequence. Provide its protein ID.
10h Its protein structure, if known.
Good luck!